Table of Contents
Intro
This is carrying on from a previous post on finding the start of the malicious user code in the MFC application. This post was to quickly cover the issue of how to continue to review code in IDA as it gets decoded into new memory maps.
Due to the size of this sample I won’t be continuing to analyze every assembly instruction and will use a more dynamic approach to attempt to locate the key areas big actions take place like copying itself to a new location and deleting it’s original file as well as performing a series of posts to a large collection of C&C IPs.
The malware sample used in this blog post
- MD5 hash:
a4513379dad5233afa402cc56a8b9222 - VirusTotal link to sample: https://www.virustotal.com/gui/file/ccd380ea868ffad4f960d7455fecf88c2ac3550001bbb6c21c31ae70b3bbf4f6/detection
Dealing with decoded bytes into new memory map
Memory allocation and passing control
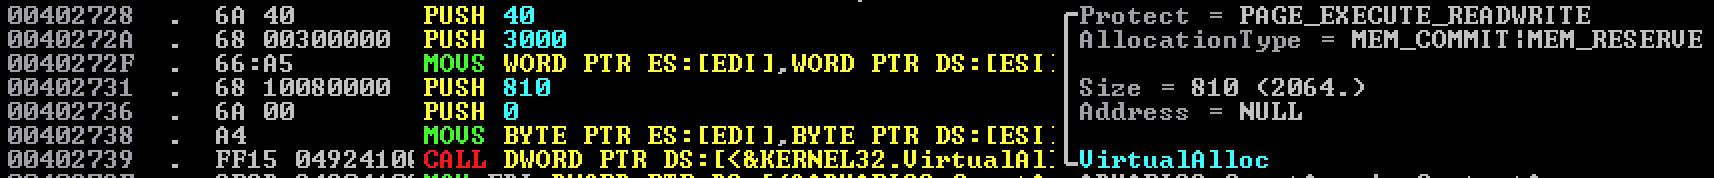
VirtualAlloc will be called all over to allocate new memory in order to decode or decrypt bytes to a new location. Sometimes the encoded bytes are just sitting in data segments or program code and sometimes it will pull it from a resource (this binary does both).
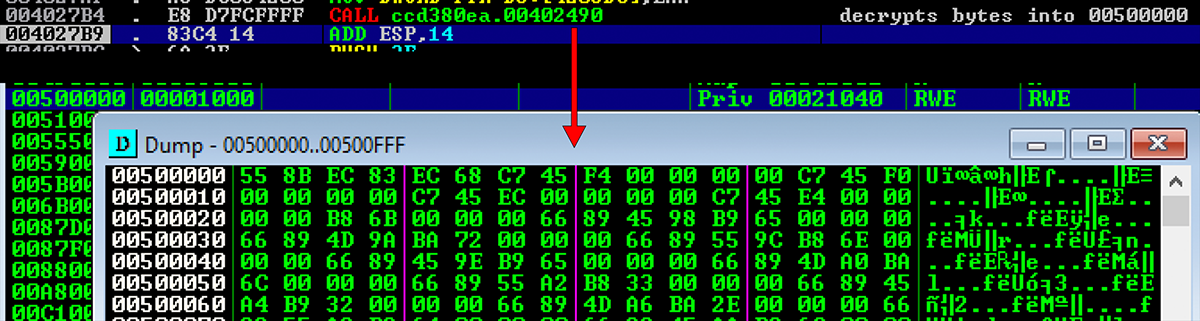
We start back up where we left off in the previous post from a call coming out of the DialogFunc. We can see below a call to VirtualAlloc which creates a new section
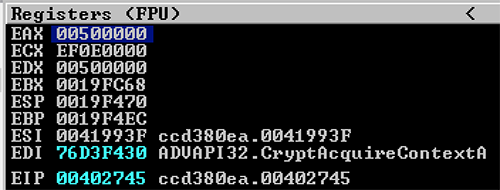
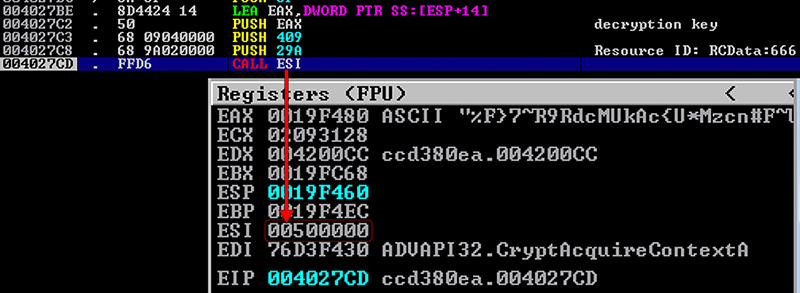
EAX shows that the memory address allocated was at 00500000
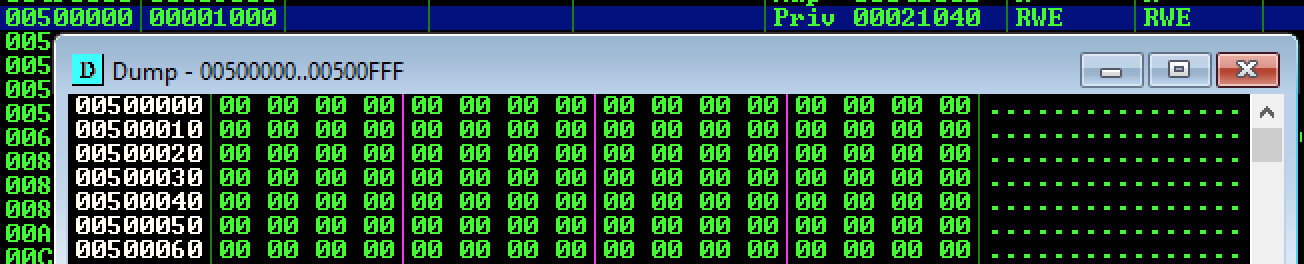
When we observe this memory map we see it is empty
However, in the function that performs decryption using the key were observed earlier it will run through a decryption routine and copy the bytes decoded into the new memory section before calling into that section to continue execution.
Viewing new bytes in IDA
The original binary loaded into IDA will only have the encoded bytes and not the decoded bytes to work with and view. While you can now F7 into the new code with the debugger you won’t be able to match this up in IDA yet.
To accomplish this you can:
- Dump the memory map to file
- Open the new file in IDA
- Rebase the program to show the same memory addresses as in the debugger
Dump the memory map to file
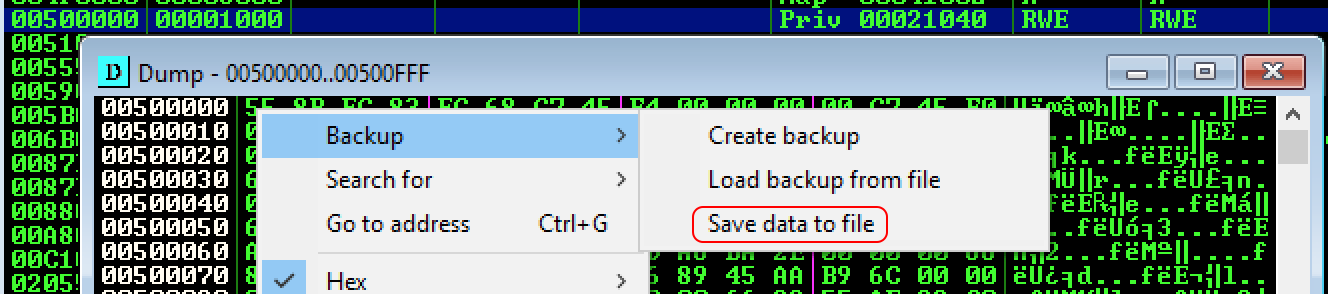
In Immunity Debugger (OllyDbg) press ALT+M to view the memory maps and locate 00500000. From here you can right click and select Backup->Save data to file.
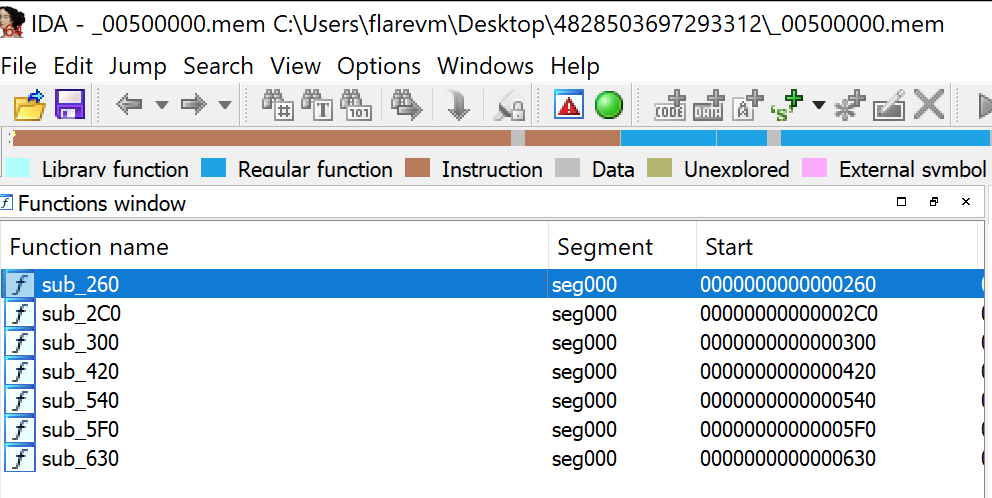
Open the new file in IDA
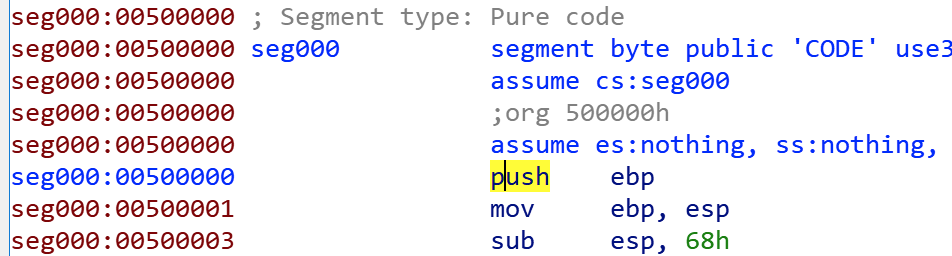
Once you open this new file in IDA you will see that this is seen as a binary file but not a normal executable one (no PE headers, no exports/inports, etc). You will, however, see all the new functions in their decoded form.
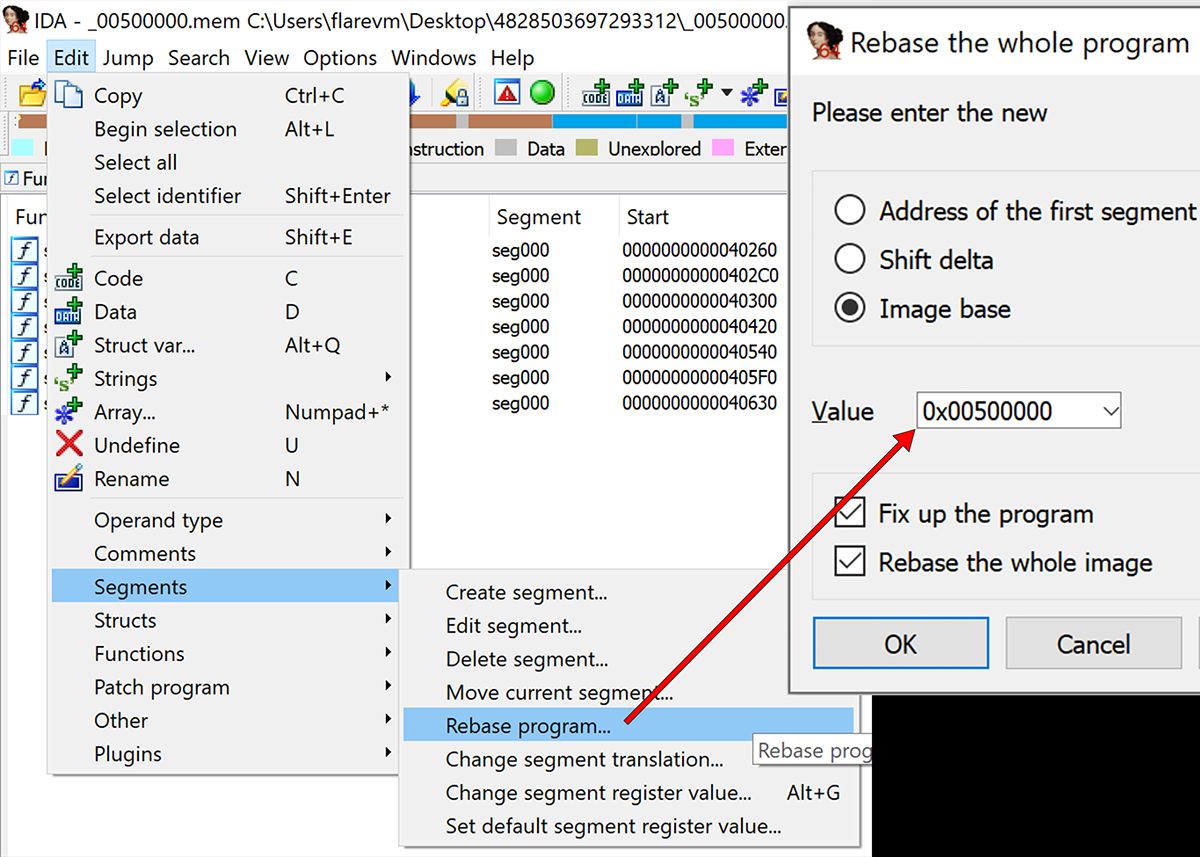
Rebase the program
When you are pulling in code from parts of memory like this it will not nessessarily know what address the program is based and if it were to guess it would probably use 00400000 by default. In this case it came from 00500000, however. The rebasing can be performed via the Edit->Segments->Rebase program option.
Note, this has no other impact than helping you visualize the full address in IDA as you see it in the debugger.
Upon applying this change your code will reflect the same addresses you see in the debugger as shown below