
Intro
This is a follow on to the first post on this, Manually Unpacking Malware, where I talked about a way to break on the real entry point of a packed malware sample. This is a second technique called call stack backtracing wherein you find a system call to break on and then traverse backward in the chain of function calls to get to the real origin.
The malware sample used in this blog post
- MD5 hash:
5B47FBC2DA1868022F30317EC7DDA39F - VirusTotal link to sample: https://www.virustotal.com/gui/file/1bb8c898b249c47249c31d9901b12add9d307f027e5cbff97937769d7e5c732e/detection
Call stack backtracing
Definition (from Technopedia)
A stack trace is a report that provides information about program subroutines. It is commonly used for certain kinds of debugging, where a stack trace can help software engineers figure out where a problem lies or how various subroutines work together during execution.
A stack trace is also known as a stack traceback or a stack backtrace. [source]
This can usually be graphically or textually visualized to understand how the chain of functions are calling each other. We will use Immunity Debugger to accomplish this.
For our purposes, the idea here is that you need to successfully break at some point within this callstack and then walk backward to the root of the chain to find where it started.
An example fragment from our sample
The following is an example of one point in this piece of malware where it calls WinExec which in turn calls CreateProcessA which in turn calls CreateProcessInternalA.
In Immunity Debugger’s stack view, we can see how this gets visualized. When a call from a function is made it pushes the memory address just after the call onto the stack. This address is seen in the image below next to the RETURN comments.
Just above this is the stack memory address of which you can highlight and press enter to jump backward to the previous stackframe to see what called it. This allows us to follow it backward and traverse the call stack until we get to the starting code of the thread. Immunity Debugger will also provide some lines to help identify these stack frames.
The green dots below indicate the stack addresses you can jump between to go from frame to frame. 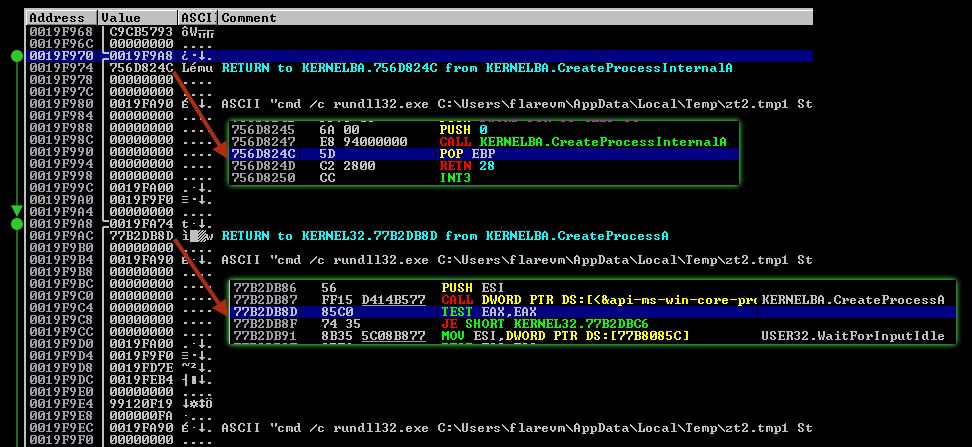 (click image for full resolution)
Continuing, we jump to where the original KERNEL32.WinExec call occured. 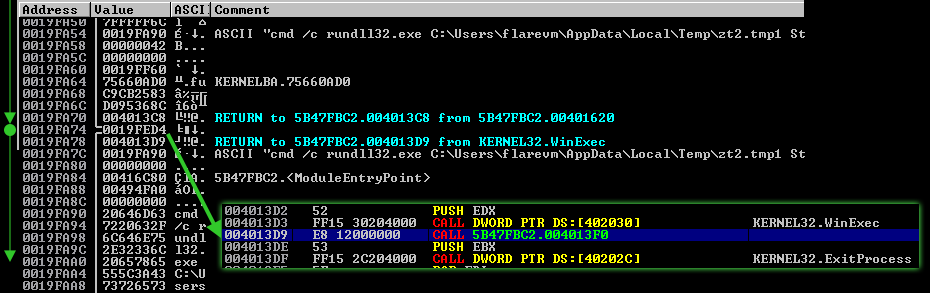 (click image for full resolution)
Getting OEP in our sample via this technique
To gain the true OEP address of the unpacked malware in our sample we can start to look for calls to functions that are typically seen very early on in the lifecycle of a Windows application. The following set of functions are possible candidates:
KERNEL32.GetStartupInfoA
KERNEL32.GetCommandLineA
Upon opening the malware binary in Immunity Debugger, setting a breakpoint on these two functions and hitting F9, we land in the KERNEL32 memory section at the GetStartupInfoA function. In this case, it was called at the first level in the main thread and shows a return address value of 00401730. 
If we follow to the return address of 00401730 we can start to scroll up through the instructions to find the beginning of the function. You will see the instruction PUSH EBP in the preamble of the functions assembly. Another indicator we are at the beginning is the RETN instruction a little higher above it. 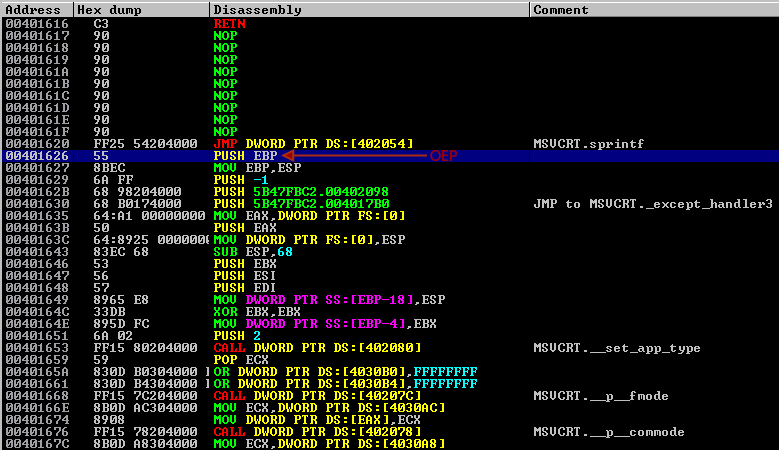
Conclusion
The backtracing technique is useful for many purposes beyond this in reverse engineering. A common use outside of finding where the unpacked code starts is when identifying the use of strings or syscalls elsewhere in the binary and further understanding how and why they are used (without having to work through the entire binary to get to the most interesting parts).
A final caveat to this is when there are multiple threads running. Each will have their own stack, so you should be aware of this and set breakpoints on the creation of new threads and backtrace each one individually.